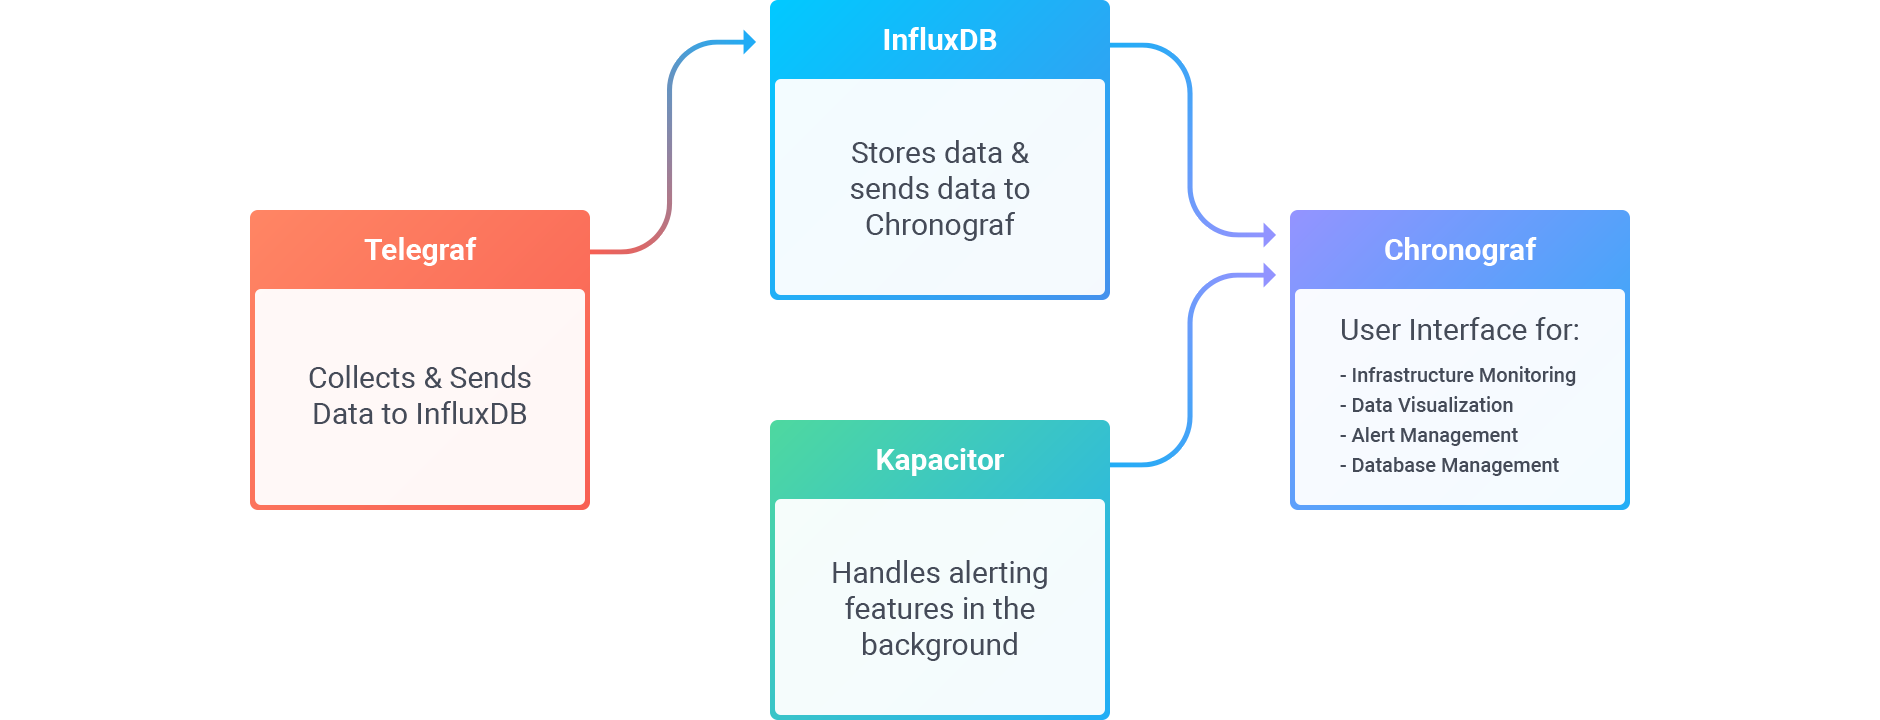
Get started with the InfluxData Platform
To get started with the InfluxDB 2.0 platform, see InfluxDB Cloud or InfluxDB OSS 2.0.
To get started with the InfluxData 1.x platform, download and install each component of the TICK stack, or Install the InfluxData Sandbox, and then follow the steps below.

Understand how Telegraf writes data to InfluxDB
Once Telegraf is installed and started, it will send system metrics to InfluxDB by default, which automatically creates a ‘telegraf’ database.
The configuration file for Telegraf specifies where metrics come from and where they go (inputs and outputs). In this example, we’ll focus on CPU data, which is one of the default system metrics generated by Telegraf. For this example, it is worth noting some relevant values:
[agent].interval- declares the frequency at which system metrics will be sent to InfluxDB.[[outputs.influxdb]]- declares how to connect to InfluxDB and the destination database, which is the default ‘telegraf’ database.[[inputs.cpu]]- declares how to collect the system cpu metrics to be sent to InfluxDB. Enabled by default.
For details about the configuration file, see Get started with Telegraf.
Query data in InfluxDB
As reviewed above, Telegraf is sending system data, including CPU usage, to InfluxDB. There are two ways you can query your InfluxDB data:
- In Chronograf with the Data Explorer. Use the builder to select from your existing data and allow Chronograf to format the query for you. Alternatively, manually enter and edit a query. You can move between using the builder and manually editing the query.
- Using the command line interface.
Query example:
SELECT "usage_system",
       "usage_user"
FROM "telegraf"."autogen"."cpu"
WHERE time > now() - 30m
Visualize that data in a Chronograf dashboard
Now that you’ve explored your data with queries, you can build a dashboard in Chronograf to visualize the data. For details, see Create a dashboard and Using pre-created dashboards.
Create an alert in Kapacitor based on that data
Since InfluxDB is running on localhost:8086, Kapacitor finds it during start up and creates several subscriptions on InfluxDB. These subscriptions tell InfluxDB to send all the data it receives from Telegraf to Kapacitor.
For step-by-step instructions on how to set up an alert in Kapacitor based on your data, see Creating Chronograf alert rules.
Support and feedback
Thank you for being part of our community! We welcome and encourage your feedback and bug reports for and this documentation. To find support, the following resources are available:
InfluxDB Cloud customers can contact InfluxData Support.