Use Grafana with InfluxDB
This page documents an earlier version of InfluxDB. InfluxDB v2.1 is the latest stable version. See the equivalent InfluxDB v2.1 documentation: Use Grafana with InfluxDB OSS.
Use Grafana or Grafana Cloud to visualize data from your InfluxDB v1.8 instance.
Required
- The instructions in this guide require Grafana Cloud or Grafana v7.1+. For information about using InfluxDB with other versions of Grafana, see the Grafana documentation.
- To use Flux, use InfluxDB 1.8.1+ and enable Flux in your InfluxDB configuration file.
- Start InfluxDB.
- Sign up for Grafana Cloud or download and install Grafana.
- Visit your Grafana Cloud user interface (UI) or, if running Grafana locally,
start Grafana and visit
http://localhost:3000in your browser. - In the left navigation of the Grafana UI, hover over the gear icon to expand the Configuration section. Click Data Sources.
- Click Add data source.
- Select InfluxDB from the list of available data sources.
- On the Data Source configuration page, enter a name for your InfluxDB data source.
- Under Query Language, select one of the following:
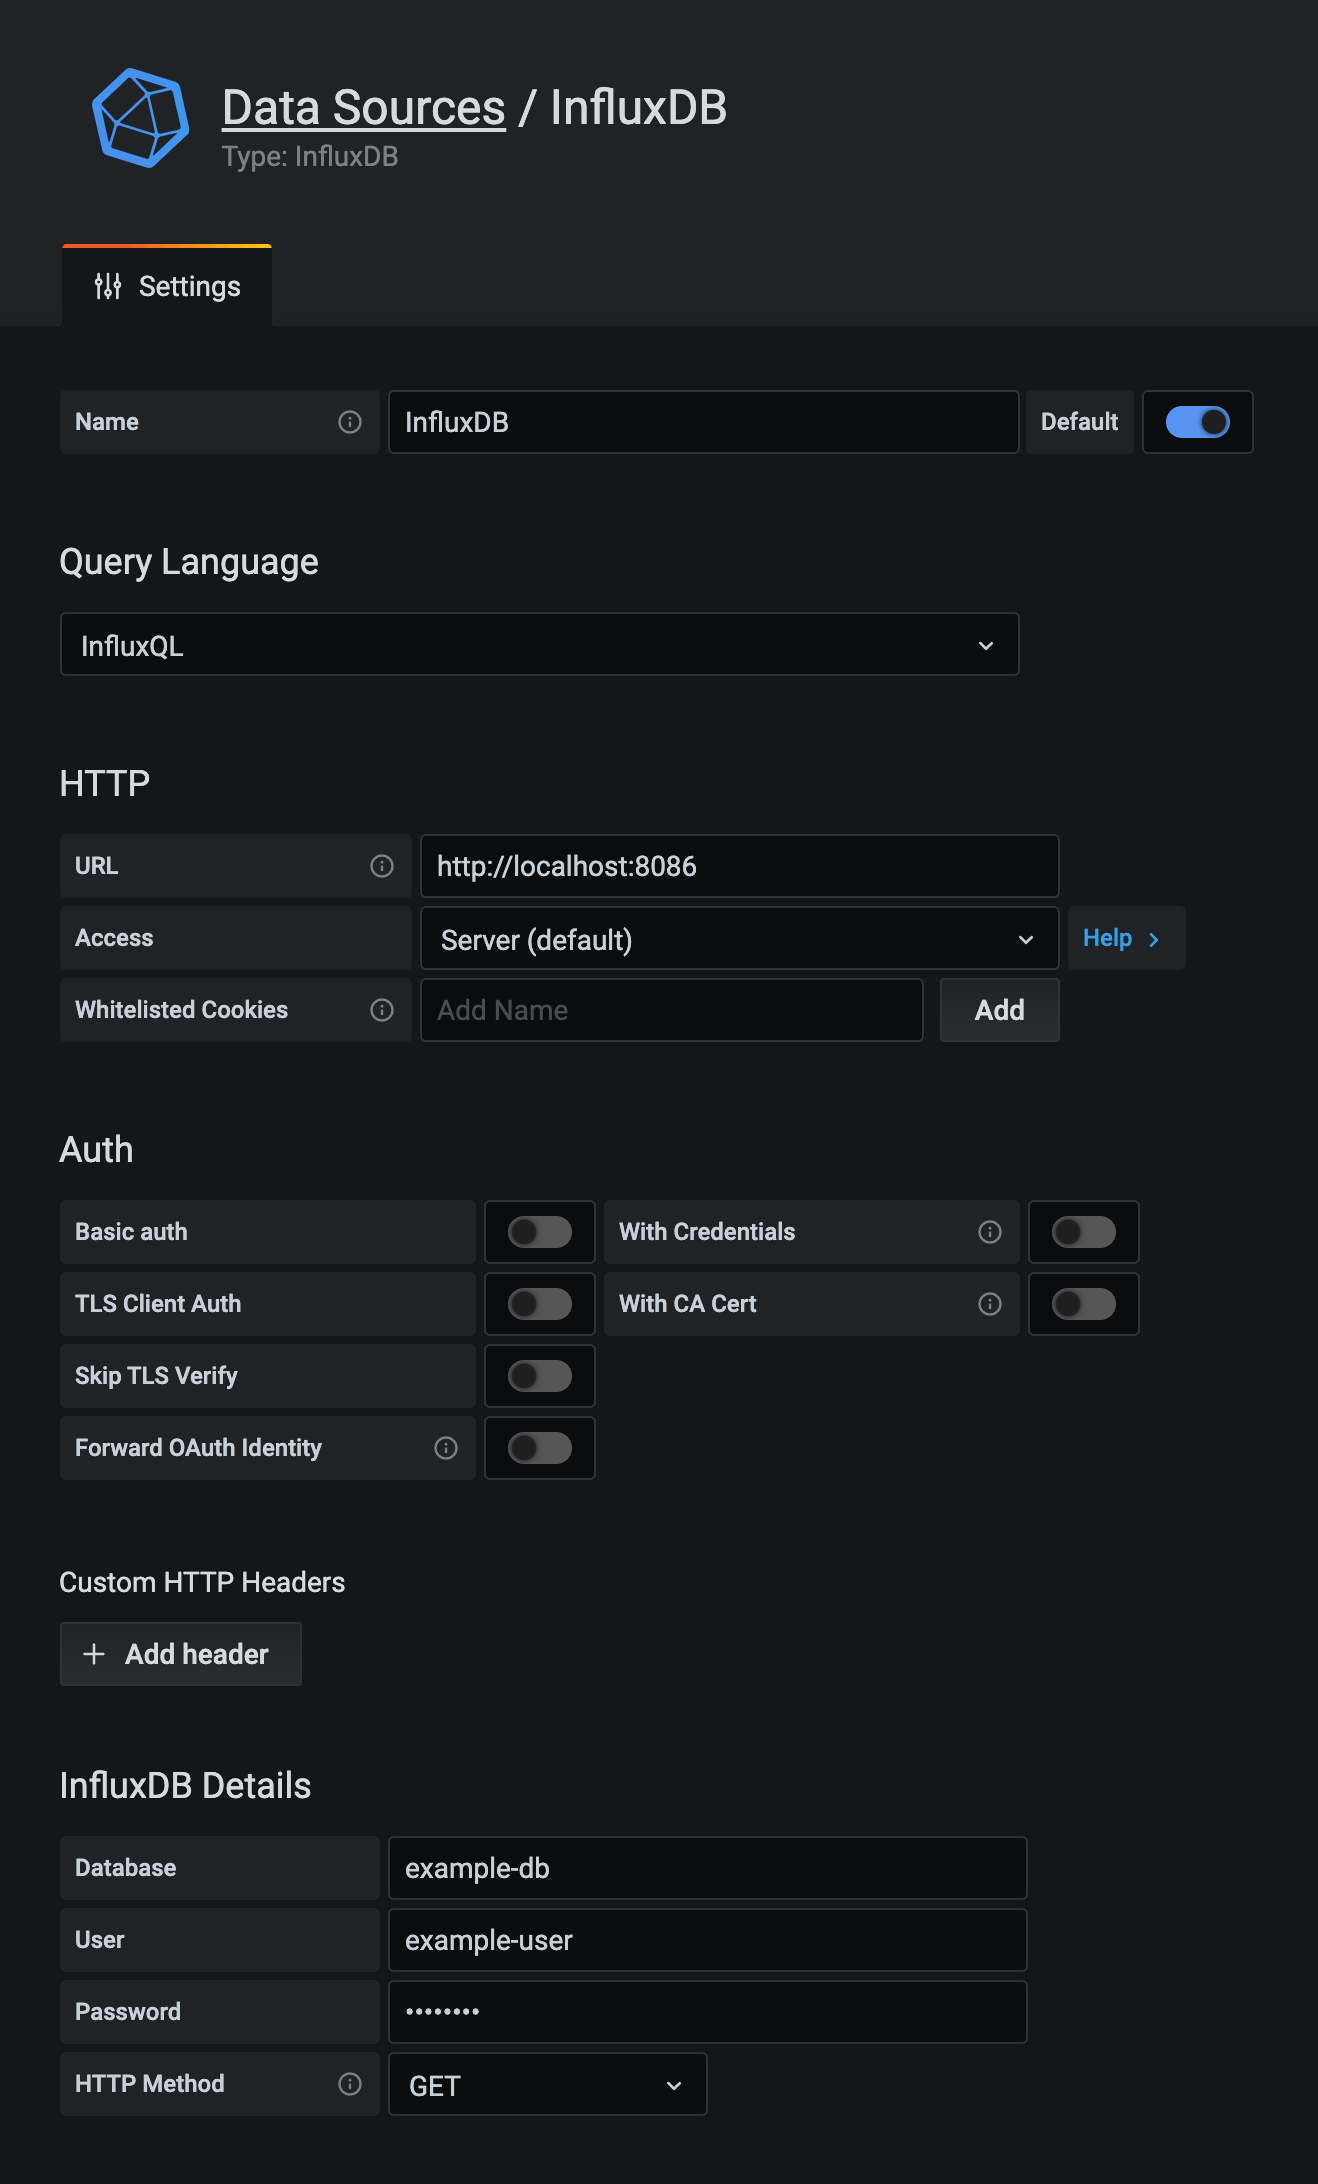
Configure Grafana to use InfluxQL
With InfluxQL selected as the query language in your InfluxDB data source settings:
-
Under HTTP, enter the following:
-
URL: Your InfluxDB URL.
http://localhost:8086/ -
Access: Server (default)
-
-
Under InfluxDB Details, enter the following:
- Database: your database name
- User: your InfluxDB username (if authentication is enabled)
- Password: your InfluxDB password (if authentication is enabled)
- HTTP Method: Select GET or POST (for differences between the two, see the query HTTP endpoint documentation)
-
Provide a Min time interval (default is 10s).

- Click Save & Test. Grafana attempts to connect to InfluxDB and returns the result of the test.
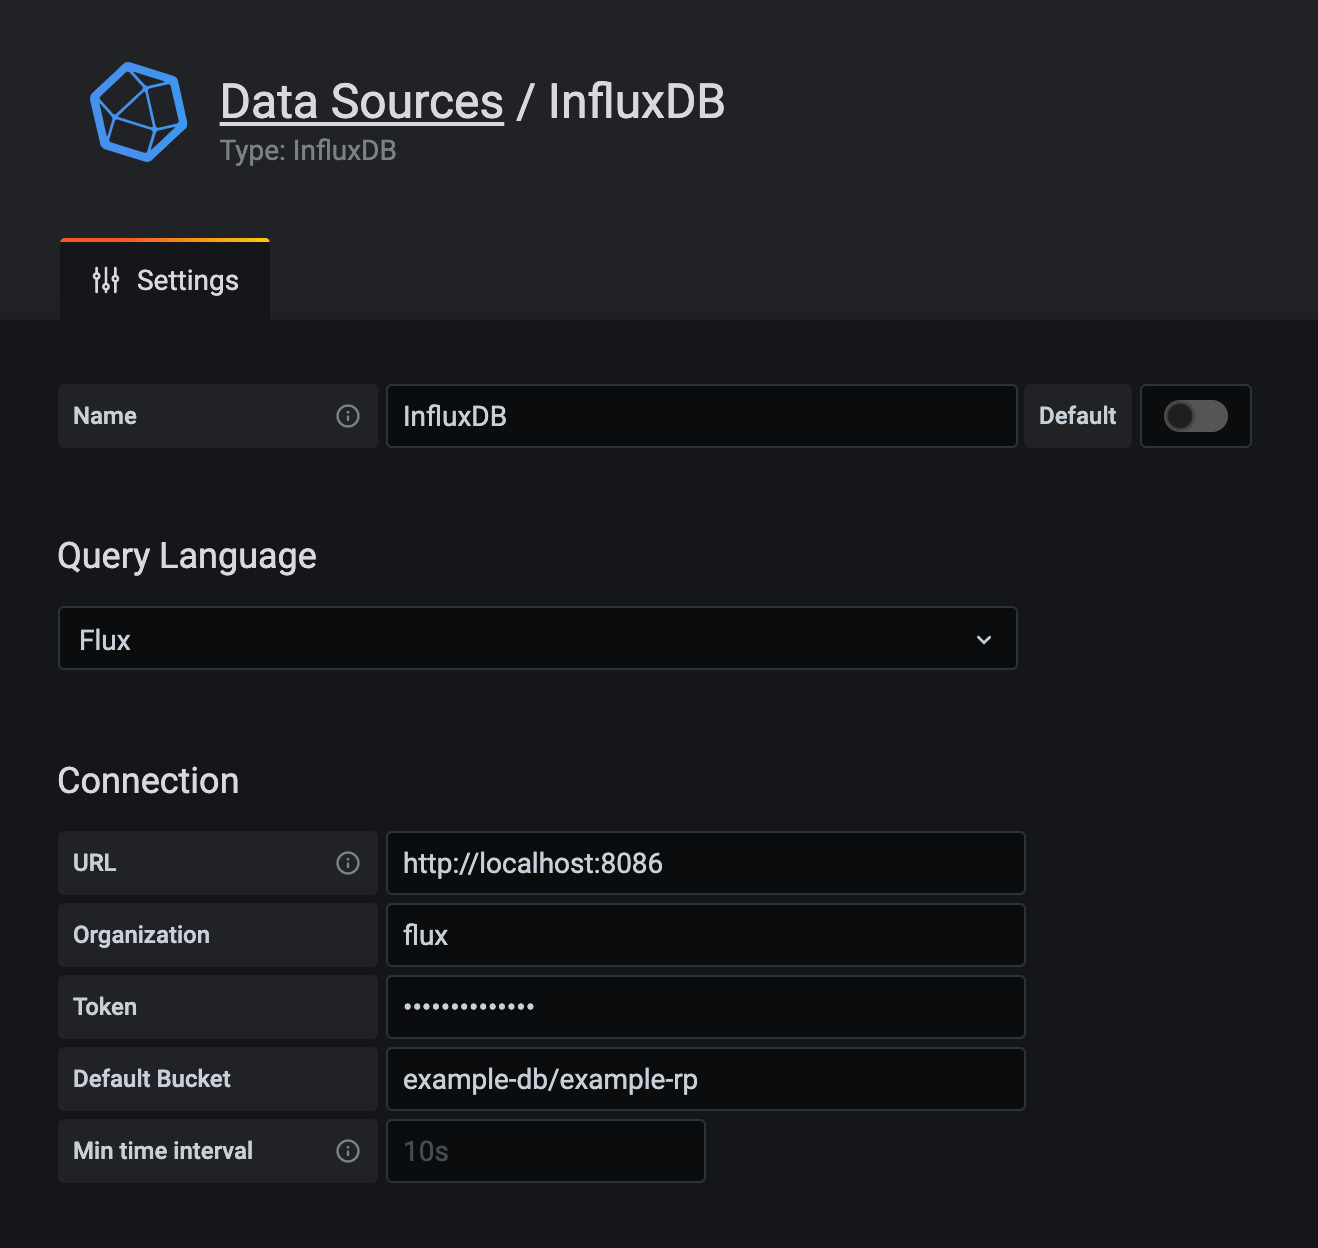
Configure Grafana to use Flux
With Flux selected as the query language in your InfluxDB data source, configure your InfluxDB connection:
-
Ensure Flux is enabled in InfluxDB.
-
Under Connection, enter the following:
-
URL: Your InfluxDB URL.
http://localhost:8086/ -
Organization: Provide an arbitrary value.
-
Token: If InfluxDB authentication is enabled, provide your InfluxDB username and password using the following syntax:
# Syntax
username:password

# Example
johndoe:mY5uP3rS3crE7pA5Sw0Rd
If authentication is not enabled, leave blank.
-
Default Bucket: Provide a default database and retention policy combination using the following syntax:
# Syntax database-name/retention-policy-name # Examples example-db/example-rp telegraf/autogen -
Min time interval: Grafana minimum time interval.
-

- Click Save & Test. Grafana attempts to connect to InfluxDB and returns the result of the test.
Support and feedback
Thank you for being part of our community! We welcome and encourage your feedback and bug reports for InfluxDB and this documentation. To find support, the following resources are available:
InfluxDB Cloud and InfluxDB Enterprise customers can contact InfluxData Support.