Histogram visualization
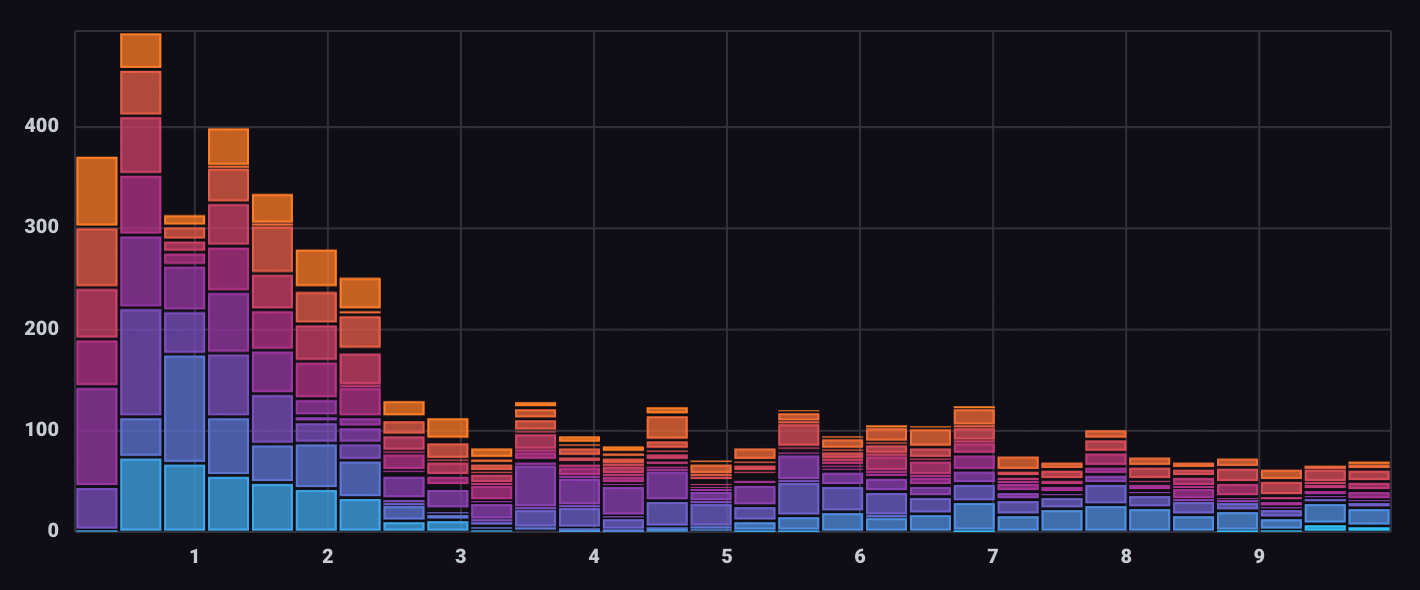
A histogram is a way to view the distribution of data. The y-axis is dedicated to count, and the X-axis is divided into bins.

Select the Histogram option from the visualization dropdown in the upper left.
Histogram behavior
The Histogram visualization is a bar graph that displays the number of data points that fall within “bins” – segments of the X axis with upper and lower bounds. Bin thresholds are determined by dividing the width of the X axis by the number of bins set using the Bins option. Data within bins can be further grouped or segmented by selecting columns in the Group By option.
The Histogram visualization automatically bins, segments, and counts data. To work properly, query results should not be structured as histogram data.
Histogram Controls
To view Histogram controls, click Customize next to the visualization dropdown.
Data
- X Column: The column to select data from.
- Group By: The column to group by.
Options
- Color Scheme: Select a color scheme to use for your graph.
- Positioning: Select Stacked to stack groups in a bin on top of each other. Select Overlaid to overlay groups in each bin.
- Bins: Enter a number of bins to divide data into or select Auto to automatically
calculate the number of bins.
- Auto or Custom: Enable or disable auto-setting.
X Axis
- X Axis Label: Label for the x-axis.
- X Axis Domain: The x-axis value range.
- Auto: Automatically determine the value range based on values in the data set.
- Custom: Manually specify the value range of the x-axis.
- Min: Minimum x-axis value.
- Max: Maximum x-axis value.
Legend
- Legend Orientation: Select the orientation of the legend that appears upon hover:
- Horizontal: Select to display the legend horizontally.
- Vertical: Select to display the legend vertically.
- Opacity: Adjust the legend opacity using the slider.
- Colorize Rows: Select to display legend rows in colors.
Histogram examples
View error counts by severity over time
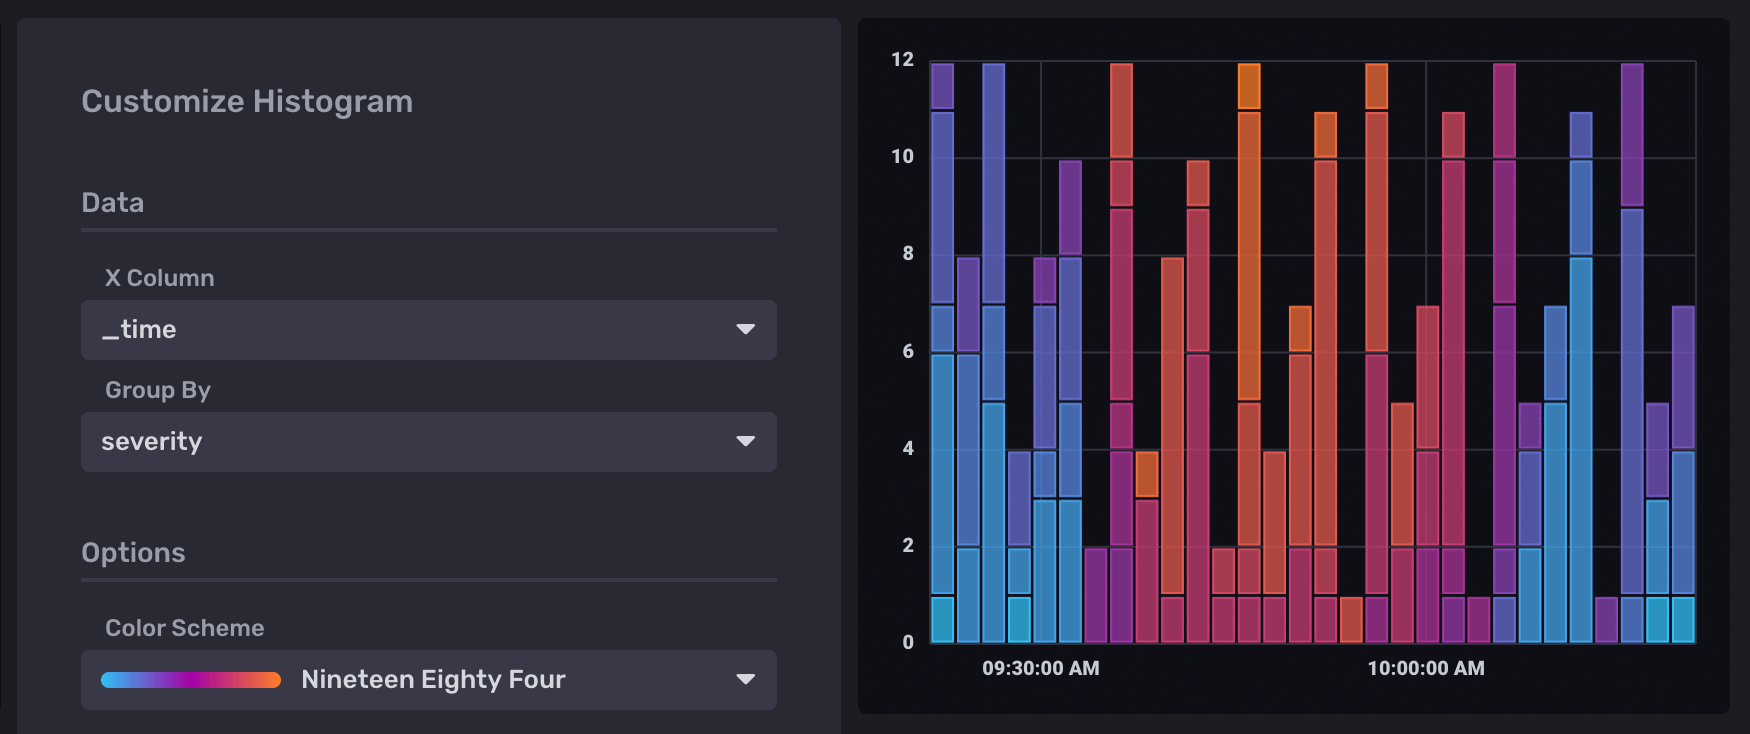
The following example uses the Histogram visualization to show the number of errors “binned” by time and segmented by severity. It utilizes data from the Telegraf Syslog plugin.
Query for errors by severity code
from(bucket: "example-bucket")
    |> range(start: v.timeRangeStart, stop: v.timeRangeStop)
    |> filter(fn: (r) => r._measurement == "syslog" and r._field == "severity_code")
Histogram settings
In the Histogram visualization options, select _time as the X Column
and severity as the Group By option:

Support and feedback
Thank you for being part of our community! We welcome and encourage your feedback and bug reports for InfluxDB and this documentation. To find support, the following resources are available:
InfluxDB Cloud and InfluxDB Enterprise customers can contact InfluxData Support.