Graph + Single Stat visualization
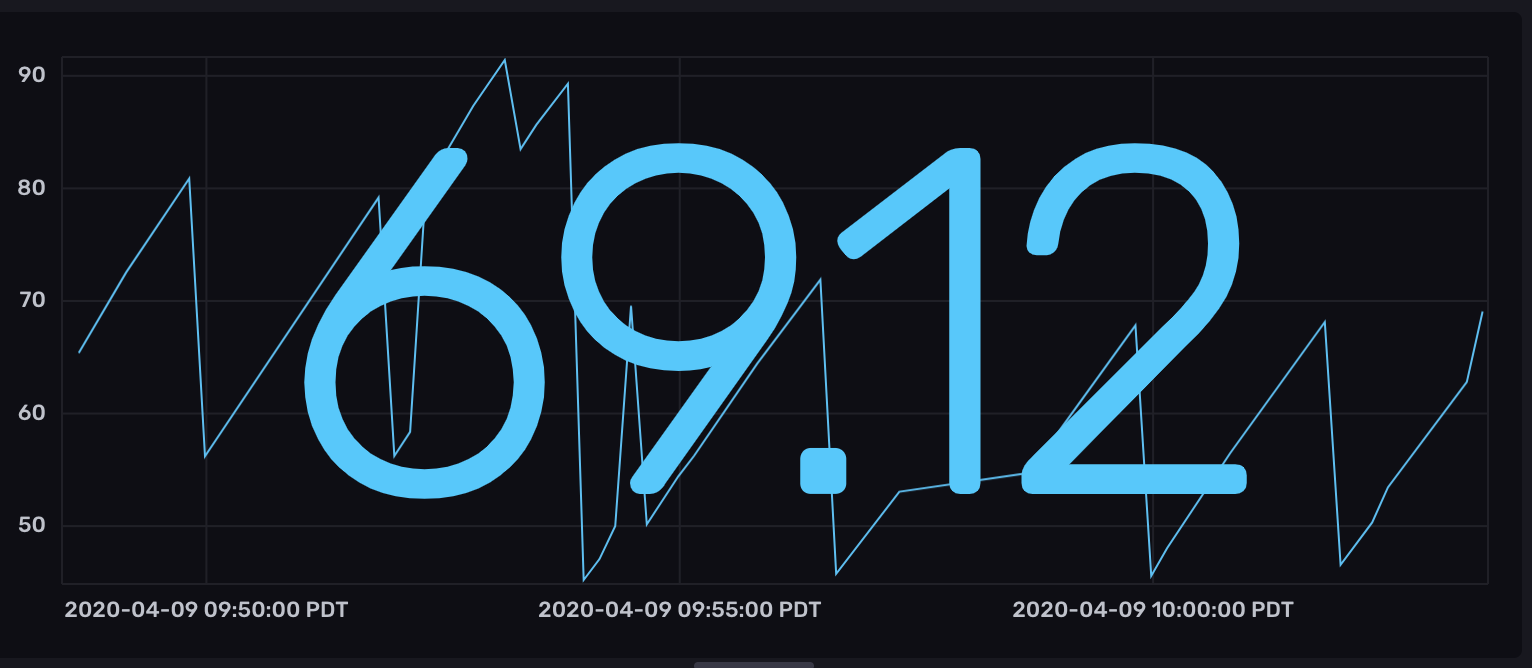
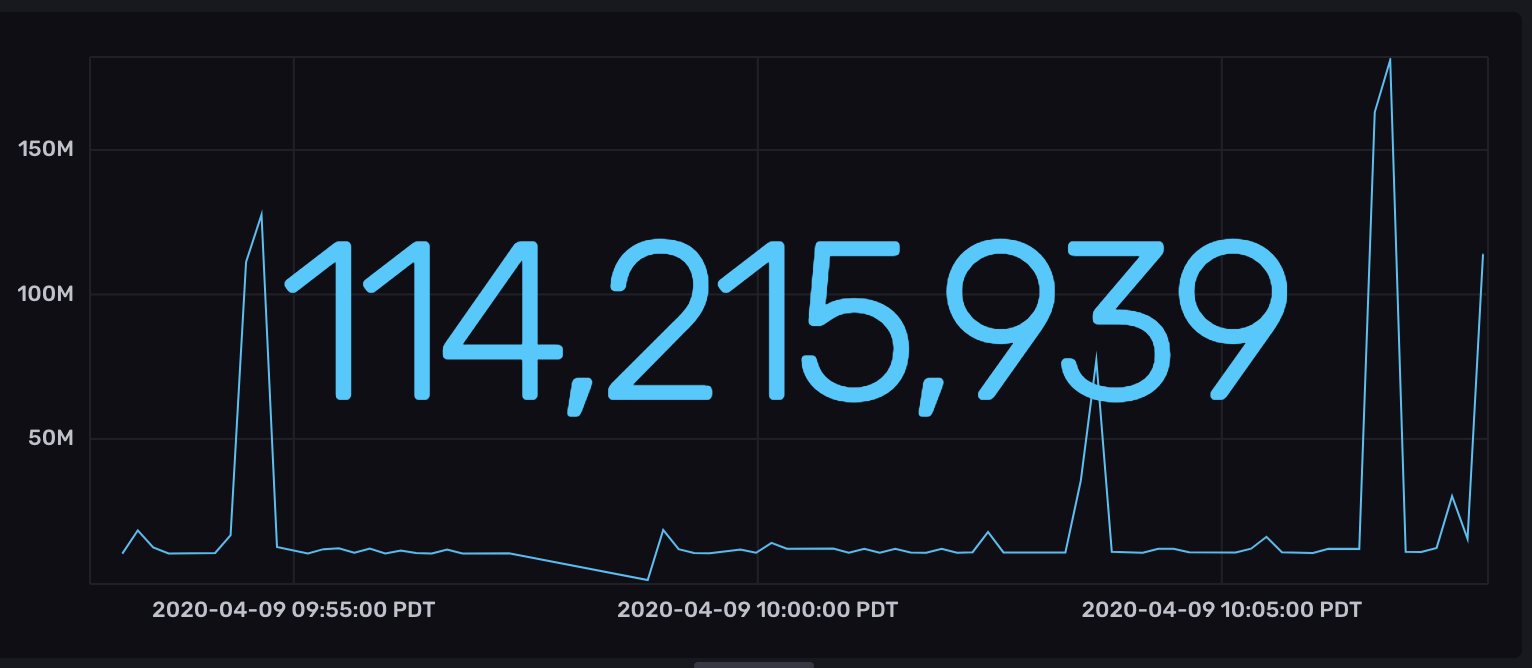
The Graph + Single Stat view displays the specified time series in a line graph and overlays the single most recent value as a large numeric value.

Select the Graph + Single Stat option from the visualization dropdown in the upper left.
Graph + Single Stat behavior
The Graph visualization color codes each table (or series) in the queried data set. When multiple series are present, it automatically assigns colors based on the selected Line Colors option.
The Single Stat visualization displays a single numeric data point. It uses the latest point in the first table (or series) returned by the query.
Queries should return one table
Flux does not guarantee the order in which tables are returned. If a query returns multiple tables (or series), the table order can change between query executions and result in the Single Stat visualization displaying inconsistent data. For consistent Single Stat results, the query should return a single table.
Graph + Single Stat Controls
To view Graph + Single Stat controls, click Customize next to the visualization dropdown.
Data
- X Column: Select a column to display on the x-axis.
- Y Column: Select a column to display on the y-axis.
- Time Format: Select the time format. Options include:
- YYYY-MM-DD HH:mm:ss ZZ
- YYYY-MM-DD hh:mm:ss a ZZ
- DD/MM/YYYY HH:mm:ss.sss
- DD/MM/YYYY hh:mm:ss.sss a
- MM/DD/YYYY HH:mm:ss.sss
- MM/DD/YYYY hh:mm:ss.sss a
- YYYY/MM/DD HH:mm:ss
- YYYY/MM/DD hh:mm:ss a
- HH:mm
- hh:mm a
- HH:mm:ss
- hh:mm:ss a
- HH:mm:ss ZZ
- hh:mm:ss a ZZ
- HH:mm:ss.sss
- hh:mm:ss.sss a
- MMMM D, YYYY HH:mm:ss
- MMMM D, YYYY hh:mm:ss a
- dddd, MMMM D, YYYY HH:mm:ss
- dddd, MMMM D, YYYY hh:mm:ss a
Options
- Line Colors: Select a color scheme to use for your graph.
- Shade Area Below Lines: Shade in the area below the graph lines.
- Hover Dimension: Select the data to display in the tooltip when you hover over the graph:
- auto or X Axis: Show all points with the same x value along the y-axis.
- Y Axis: Show all points with the same y value along the x-axis.
- X & Y Axis: Show only the point currently being hovered over.
X Axis
- Generate X-Axis Tick Marks: Select the method to generate x-axis tick marks:
- Auto: Select to automatically generate tick marks.
- Custom: To customize the number of x-axis tick marks, select this option, and then enter the following:
- Total Tick Marks: Enter the total number of ticks to display.
- Start Tick Marks At: Enter the value to start ticks at.
- Tick Mark Interval: Enter the interval in between each tick.
Y Axis
- Y Axis Label: Label for the y-axis.
- Y Value Unit Prefix:
- None: No prefix.
- SI: International System of Units (SI) or metric prefix.
- Binary: Binary multiple prefix.
- Y Axis Prefix: Prefix to be added to y-value.
- Y Axis Suffix: Suffix to be added to y-value.
- Generate Y-Axis Tick Marks: Select the method to generate y-axis tick marks:
- Auto: Select to automatically generate tick marks.
- Custom: To customize the number of y-axis tick marks, select this option, and then enter the following:
- Total Tick Marks: Enter the total number of ticks to display.
- Start Tick Marks At: Enter the value to start ticks at.
- Tick Mark Interval: Enter the interval in between each tick.
- Y Axis Domain: The y-axis value range.
- Auto: Automatically determine the value range based on values in the data set.
- Custom: Manually specify the minimum y-axis value, maximum y-axis value, or range by including both.
- Min: Minimum y-axis value.
- Max: Maximum y-axis value.
- Positioning:
- Overlaid: Display graph lines overlaid on each other.
- Stacked: Display graph lines stacked on top of each other.
Customize Single-Stat
- Prefix: Prefix to be added to the single stat.
- Suffix: Suffix to be added to the single stat.
- Decimal Places: The number of decimal places to display for the single stat.
- Auto or Custom: Enable or disable auto-setting.
Colorized Thresholds
- Base Color: Select a base or background color from the selection list.
- Add a Threshold: Change the color of the single stat based on the current value.
- Value is: Enter the value at which the single stat should appear in the selected color. Choose a color from the dropdown menu next to the value.
- Colorization: Choose Text for the single stat to change color based on the configured thresholds. Choose Background for the background of the graph to change color based on the configured thresholds.
Legend
- Hover Legend:
- Hide: Hide the legend that appears upon hover.
- Show: Show the legend upon hover.
- Orientation: Select the orientation of the legend:
- Horizontal: Select to display the legend horizontally.
- Vertical: Select to display the legend vertically.
- Opacity: Adjust the hover legend opacity using the slider.
- Colorize Rows: Select to display hover legend rows in colors.
- Orientation: Select the orientation of the legend:
- Static Legend:
- Hide: Hide the static legend.
- Show: Always show the static legend.
- Orientation: Select the orientation of the legend:
- Horizontal: Select to display the legend horizontally.
- Vertical: Select to display the legend vertically.
- Opacity: Adjust the static legend opacity using the slider.
- Colorize Rows: Select to display static legend rows in colors.
- Displayed Value: Select Latest Y Axis or Latest X Axis to determine whether the y or x axis appears on the legend.
- Height: Adjust the height of the static legend using the slider.
- Orientation: Select the orientation of the legend:
Graph + Single Stat examples
The primary use case for the Graph + Single Stat visualization is to show the current or latest value as well as historical values.
Show current value and historical values
The following example shows the current percentage of memory used as well as memory usage over time:
Query memory usage percentage
from(bucket: "example-bucket")
    |> range(start: v.timeRangeStart, stop: v.timeRangeStop)
    |> filter(fn: (r) => r._measurement == "mem" and r._field == "used_percent")
Memory allocations percentage visualization with static legend

Support and feedback
Thank you for being part of our community! We welcome and encourage your feedback and bug reports for InfluxDB and this documentation. To find support, the following resources are available:
InfluxDB Cloud and InfluxDB Enterprise customers can contact InfluxData Support.