Use Grafana with InfluxDB Cloud
Use Grafana or Grafana Cloud to visualize data from InfluxDB Cloud.
The instructions in this guide require Grafana Cloud or Grafana v7.1+.
- Sign up for InfluxDB Cloud.
- Sign up for Grafana Cloud or download and install Grafana.
- Visit your Grafana Cloud user interface (UI) or, if running Grafana locally,
start Grafana and visit
http://localhost:3000in your browser. - In the left navigation of the Grafana UI, hover over the gear icon to expand the Configuration section. Click Data Sources.
- Click Add data source.
- Select InfluxDB from the list of available data sources.
- On the Data Source configuration page, enter a name for your InfluxDB data source.
- Under Query Language, select one of the following:
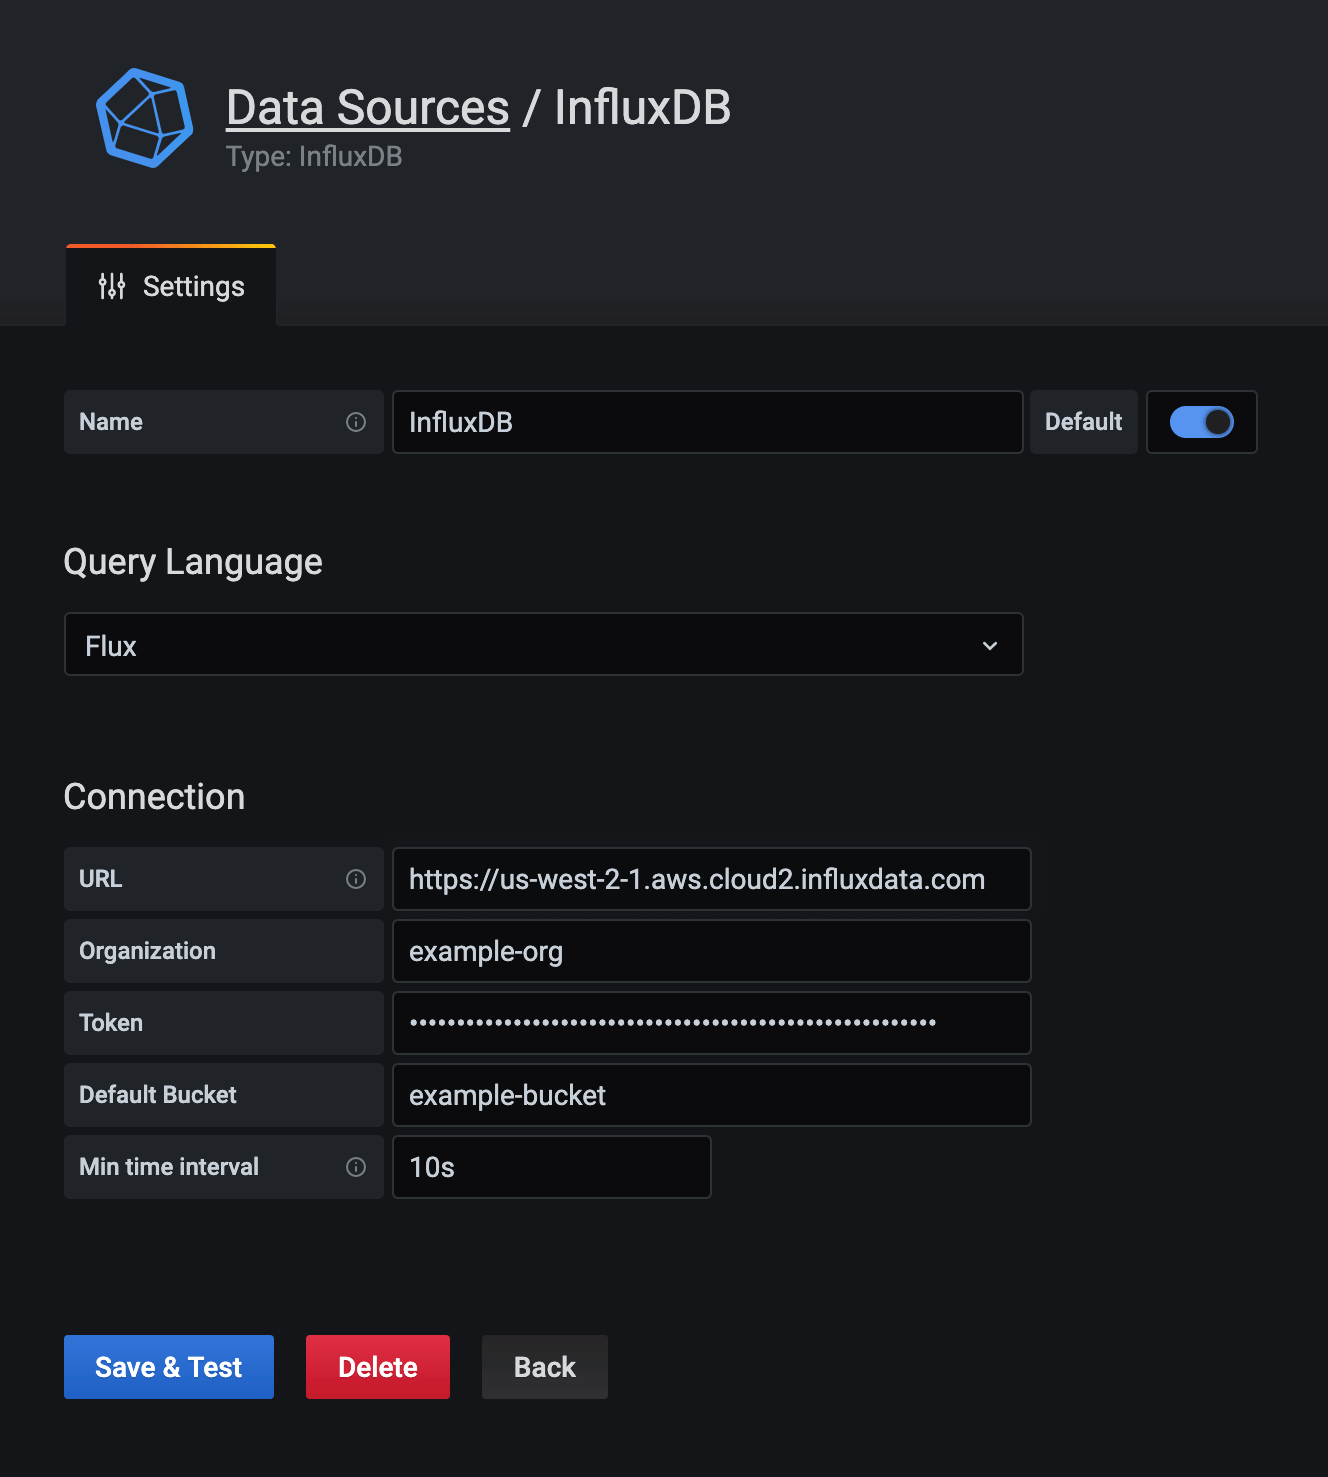
Configure Grafana to use Flux
With Flux selected as the query language in your InfluxDB data source, configure your InfluxDB connection:
-
Under Connection, enter the following:
-
URL: Your InfluxDB URL.
https://cloud2.influxdata.com -
Organization: Your InfluxDB organization name or ID.
-
Token: Your InfluxDB API token.
-
Default Bucket: The default bucket to use in Flux queries.
-
Min time interval: The Grafana minimum time interval.
-
-
Click Save & Test. Grafana attempts to connect to the InfluxDB datasource and returns the results of the test.
Configure Grafana to use InfluxQL
To query InfluxDB Cloud from Grafana using InfluxQL:
- Download and set up the
influxCLI - Create an InfluxDB DBRP mapping
- Configure your InfluxDB connection
Download and set up the influx CLI
-
Download the latest version of the
influxCLI appropriate for your local operating system. -
Create a CLI configuration that provides the required InfluxDB Cloud host, organization, and API token to all CLI commands. Use the
influx config createcommand and provide the following:- InfluxDB Cloud URL
- organization name (by default, your email address)
- API token
influx config create \
  --config-name example-config-name \
  --host-url https://cloud2.influxdata.com \
  --org example-org \
  --token My5uP3rSeCr37t0k3n
For more information about
influxCLI configurations, seeinflux config.
Create an InfluxDB DBRP mapping
When using InfluxQL to query InfluxDB Cloud, the query must specify a database and a retention policy.
Use the influx v1 dbrp create command
command to create a database/retention policy (DBRP) mapping that associates a database
and retention policy combination with an InfluxDB Cloud bucket.
DBRP mappings do not affect the retention period of the target bucket. These mappings allow queries following InfluxDB 1.x conventions to successfully query InfluxDB Cloud buckets.
Automatically create DBRP mappings on write
When using the InfluxDB 1.x compatibility API to write data to InfluxDB Cloud,
InfluxDB Cloud automatically creates DBRP mappings for buckets whose names match the
db/rp naming pattern of the database and retention policy specified in the write request.
For more information, see Database and retention policy mapping – Writing data.
Provide the following:
- database name
- retention policy name (not retention period)
- bucket ID
- (optional)
--defaultflag if you want the retention policy to be the default retention policy for the specified database
Examples
influx v1 dbrp create \
  --db example-db \
  --rp example-rp \
  --bucket-id 00xX00o0X001 \
  --default
# Create telegraf/autogen DBRP mapping with autogen
# as the default RP for the telegraf DB

influx v1 dbrp create \
  --db telegraf \
  --rp autogen \
  --bucket-id 00xX00o0X001 \
  --default

# Create telegraf/downsampled-daily DBRP mapping that
# writes to a different bucket

influx v1 dbrp create \
  --db telegraf \
  --rp downsampled-daily \
  --bucket-id 00xX00o0X002
For more information about DBRP mapping, see Database and retention policy mapping.
Configure your InfluxDB connection
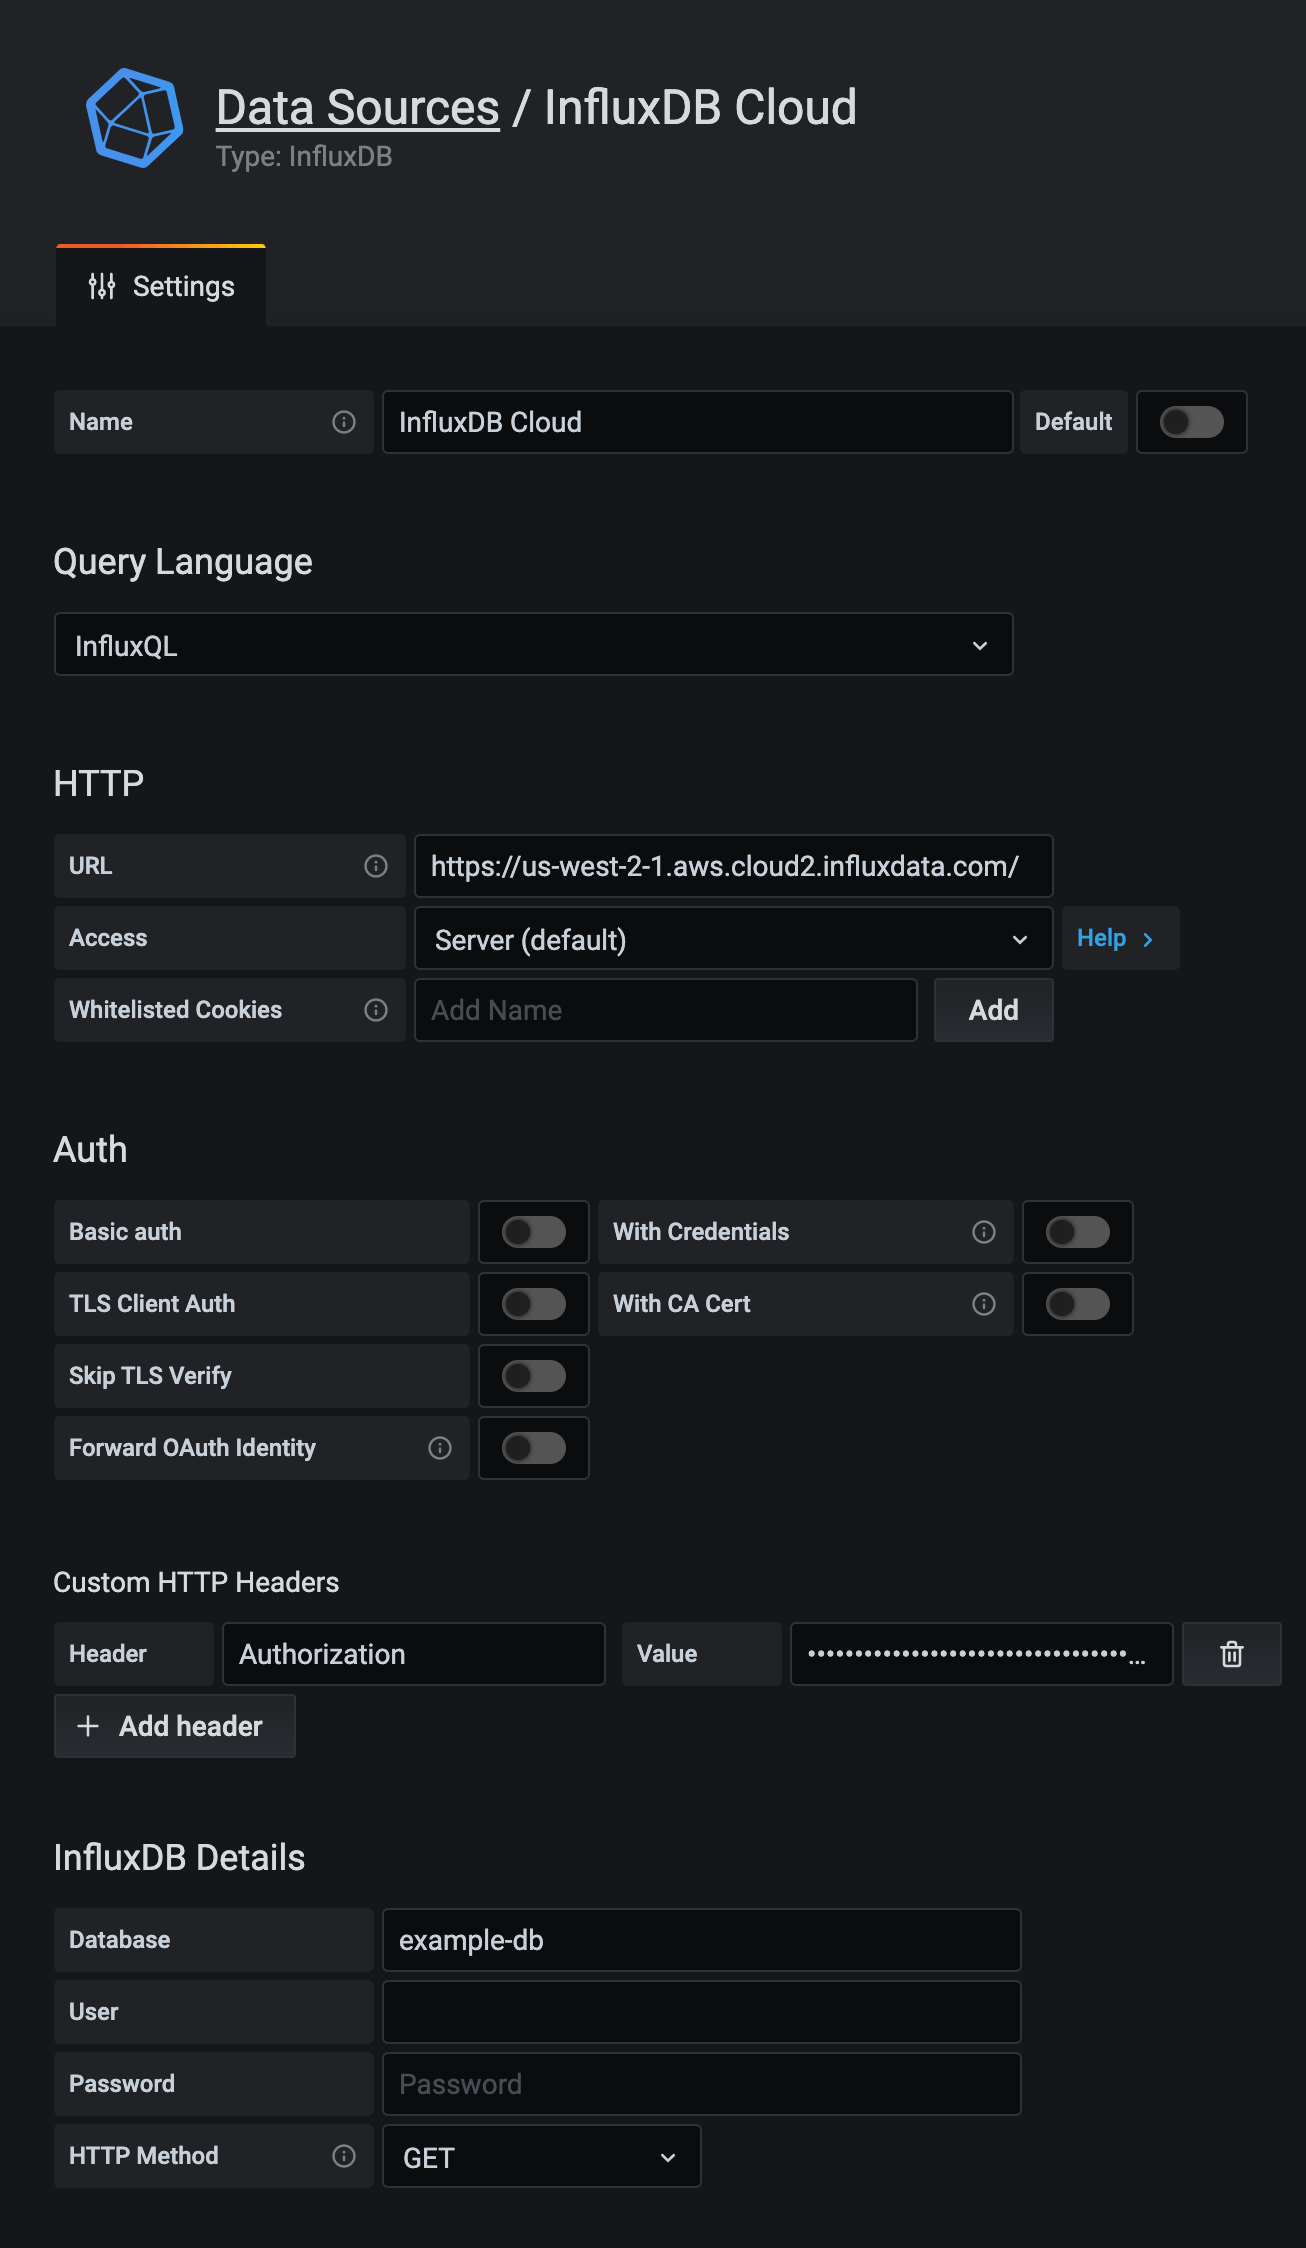
With InfluxQL selected as the query language in your InfluxDB data source settings:
-
Under HTTP, enter the following:
-
URL: Your InfluxDB Cloud URL.
https://cloud2.influxdata.com -
Access: Server (default)
-
-
Under Custom HTTP Headers, select Add Header. Provide your InfluxDB Cloud API token:
-
Header: Enter
Authorization -
Value: Use the
Tokenschema and provide your InfluxDB API token. For example:Token y0uR5uP3rSecr3tT0k3n
-
-
Under InfluxDB Details, do the following:
- Database: Enter the database name mapped to your InfluxDB Cloud bucket
- User: Leave empty
- Password: Leave empty
- HTTP Method: Select GET
-
Click Save & Test. Grafana attempts to connect to the InfluxDB Cloud data source and returns the results of the test.
Query and visualize data
With your InfluxDB connection configured, use Grafana and Flux to query and visualize time series data stored in InfluxDB Cloud.
For more information about using Grafana, see the Grafana documentation. If you’re just learning Flux, see Get started with Flux.
Support and feedback
Thank you for being part of our community! We welcome and encourage your feedback and bug reports for InfluxDB and this documentation. To find support, the following resources are available:
InfluxDB Cloud and InfluxDB Enterprise customers can contact InfluxData Support.