Export and import
Grafana Dashboards can easily be exported and imported, either from the UI or from the HTTP API.
Exporting a dashboard
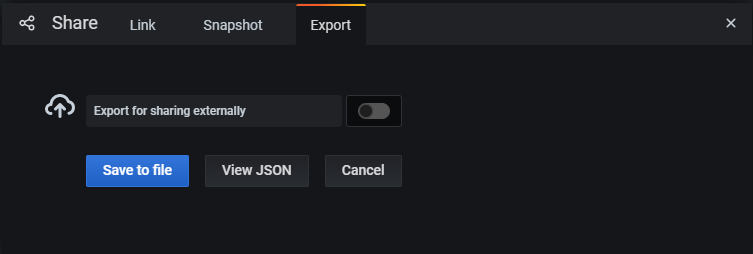
Dashboards are exported in Grafana JSON format, and contain everything you need (layout, variables, styles, data sources, queries, etc) to import the dashboard at a later time.
The export feature is accessed in the share window which you open by clicking the share button in the dashboard menu.
Making a dashboard portable
If you want to export a dashboard for others to use then it could be a good idea to add template variables for things like a metric prefix (use constant variable) and server name.
A template variable of the type Constant
will automatically be hidden in
the dashboard, and will also be added as a required input when the dashboard is imported.
Import dashboard
To import a dashboard click the + icon in the side menu, and then click Import.
From here you can upload a dashboard JSON file, paste a
In step 2 of the import process Grafana will let you change the name of the dashboard, pick what
data source you want the dashboard to use and specify any metric prefixes (if the dashboard use any). Find dashboards for common server applications at
Dashboards on Grafana.com use a new feature in Grafana 3.1 that allows the import process
to update each panel so that they are using a data source of your choice. If you are running a
Grafana version older than 3.1 then you might need to do some manual steps either
before or after import in order for the dashboard to work properly. Dashboards exported from Grafana 3.1+ have a new json section Example: These are then referenced in the dashboard panels like this: These inputs and their usage in data source properties are automatically added during export in Grafana 3.1.
If you run an older version of Grafana and want to share a dashboard on Grafana.com you need to manually
add the inputs and templatize the data source properties like above. If you want to import a dashboard from Grafana.com into an older version of Grafana then you can either import
it as usual and then update the data source option in the metrics tab so that the panel is using the correct
data source. Another alternative is to open the json file in a text editor and update the data source properties
to value that matches a name of your data source. In Grafana v5.3.4+ the export modal has new checkbox for sharing for external use (other instances). If the checkbox is not checked then the 
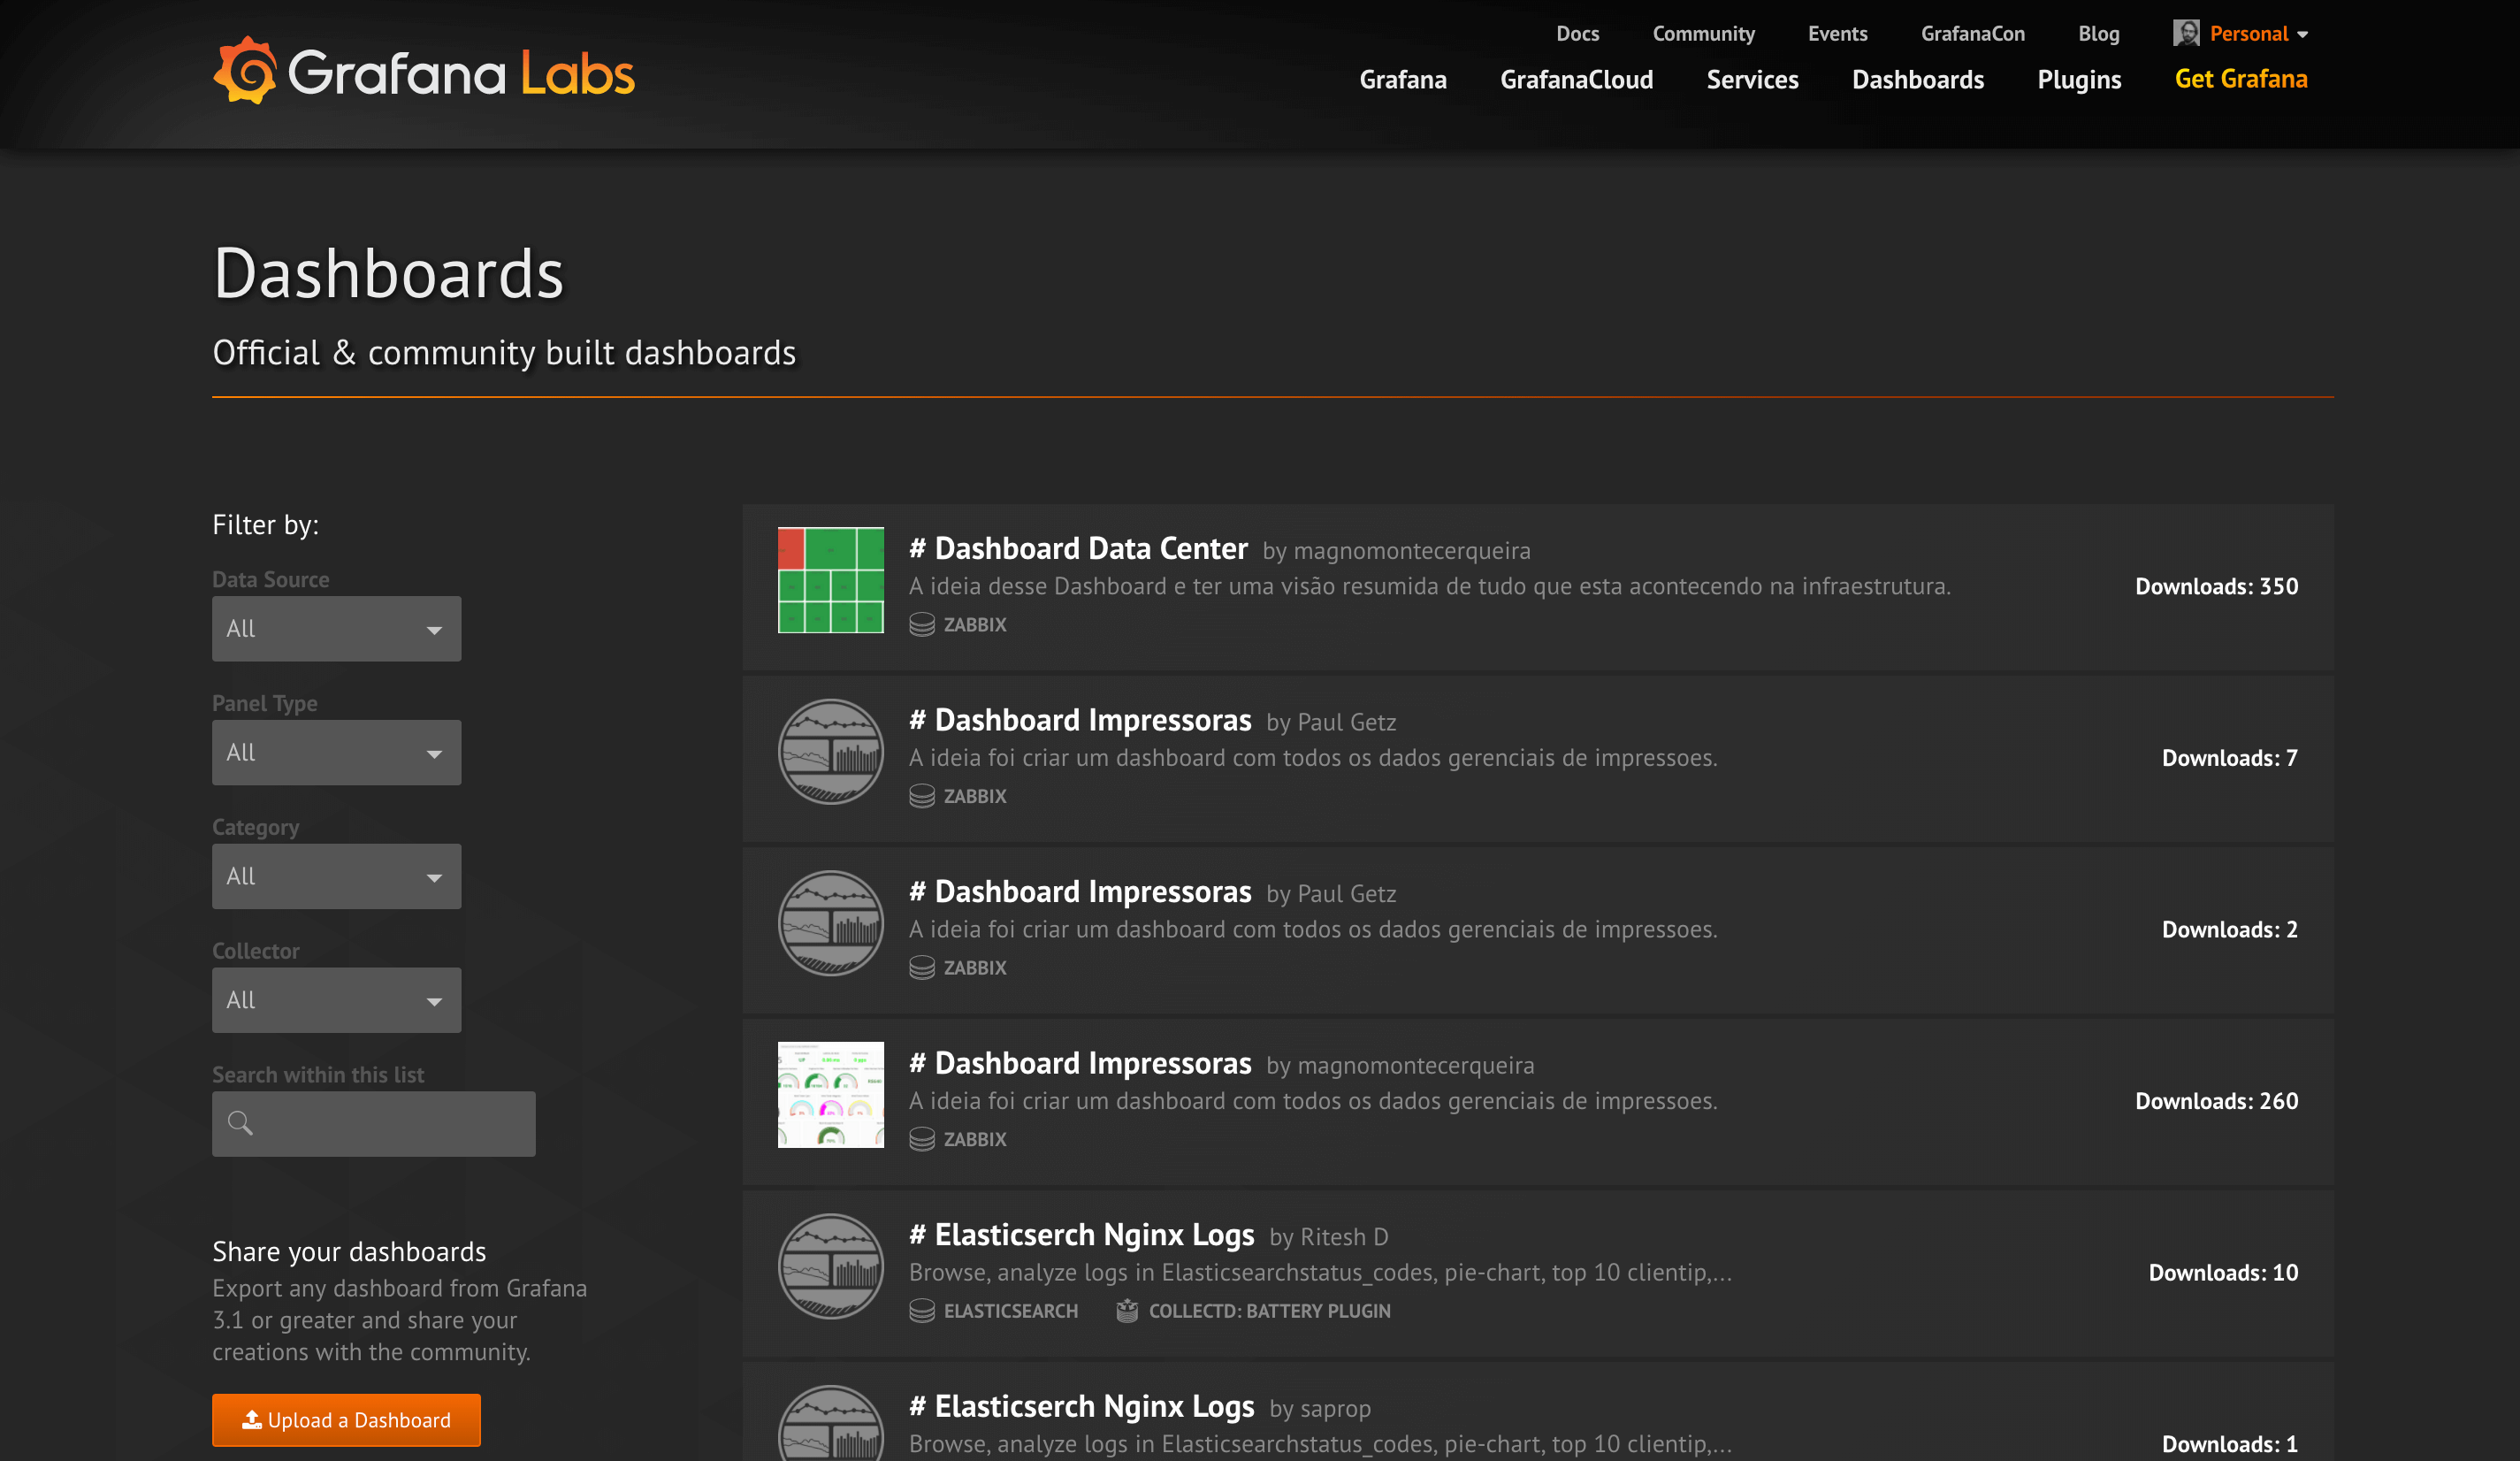
Discover dashboards on Grafana.com
Import and sharing with Grafana 2.x or 3.0
__inputs
that define what data sources and metric prefixes the dashboard uses.{
"__inputs": [
{
"name": "DS_GRAPHITE",
"label": "graphite",
"description": "",
"type": "datasource",
"pluginId": "graphite",
"pluginName": "Graphite"
},
{
"name": "VAR_PREFIX",
"type": "constant",
"label": "prefix",
"value": "collectd",
"description": ""
}
]
}
{
"rows": [
{
"panels": [
{
"type": "graph",
"datasource": "${DS_GRAPHITE}"
}
]
}
]
}
Note
__inputs
section will not be included in the exported JSON file.